
CEITEC Nano Research Infrastructure
Brno University of Technology
Purkyňova 123, 612 00 Brno
Czech Republic
 +420 54114 9207
 nano@ceitec.vutbr.cz
Consumables | wh | ShP | i | feedback


Numbers and Statistics
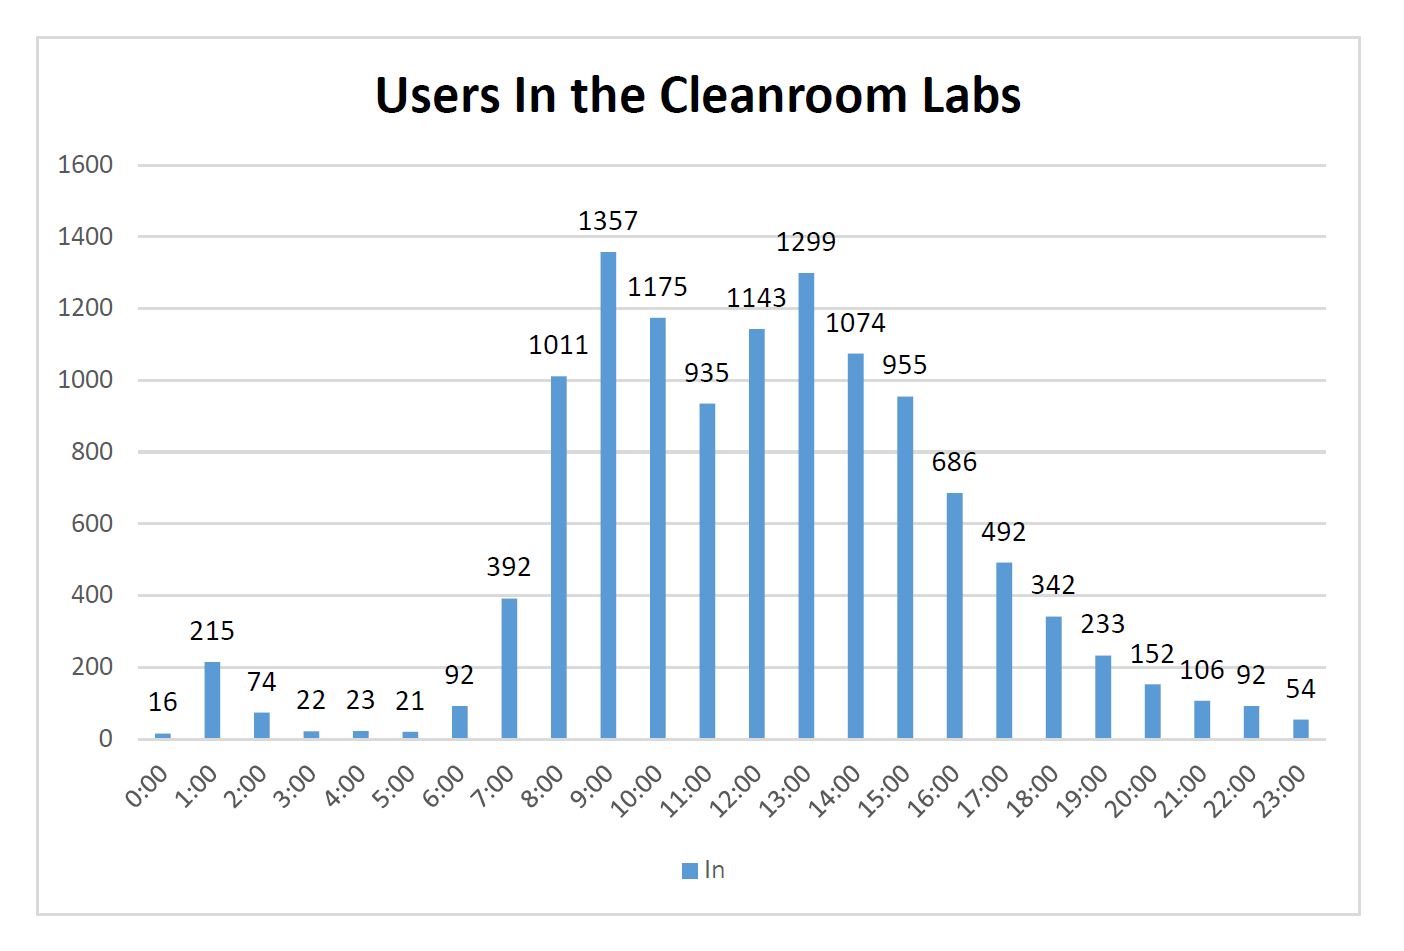
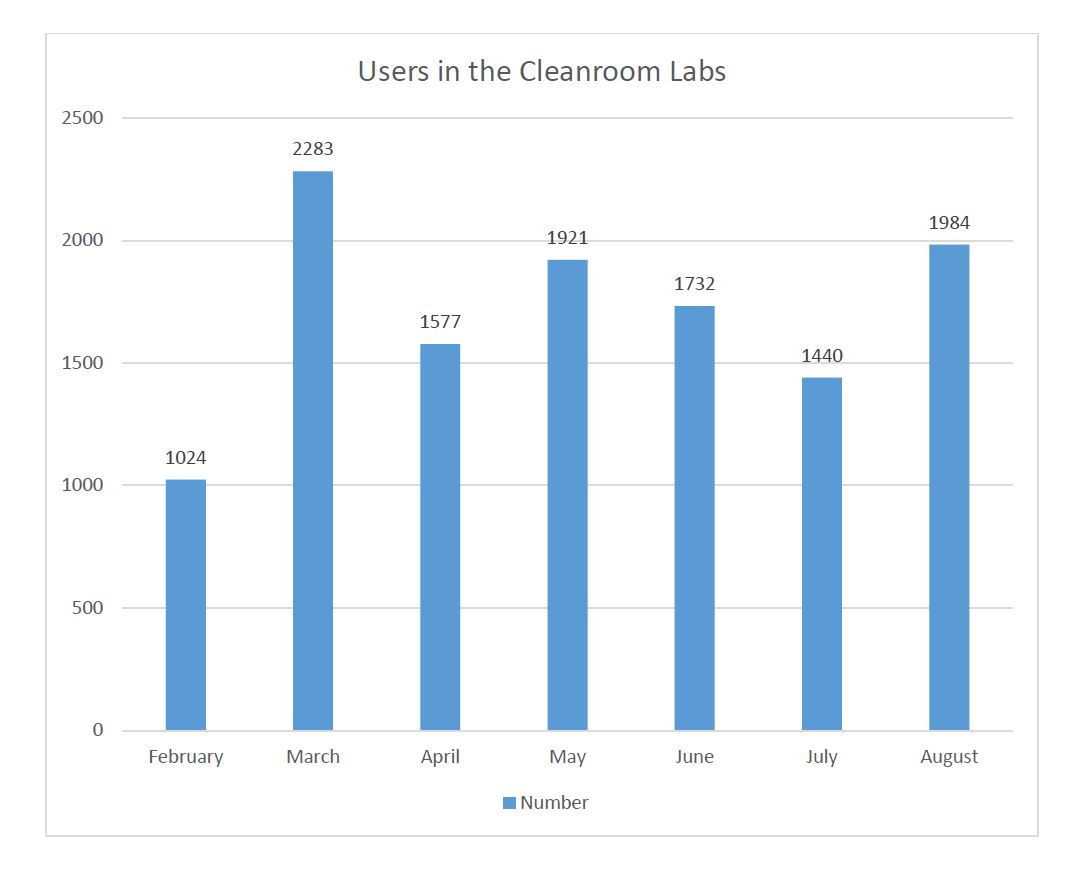
We have got some statistic numbers collected from our counter system.
First graph represents the number of entries to the Cleanroom per hour and the second graph represents the number of entries to the Cleanroom per month. The counting period is February–August 2017.